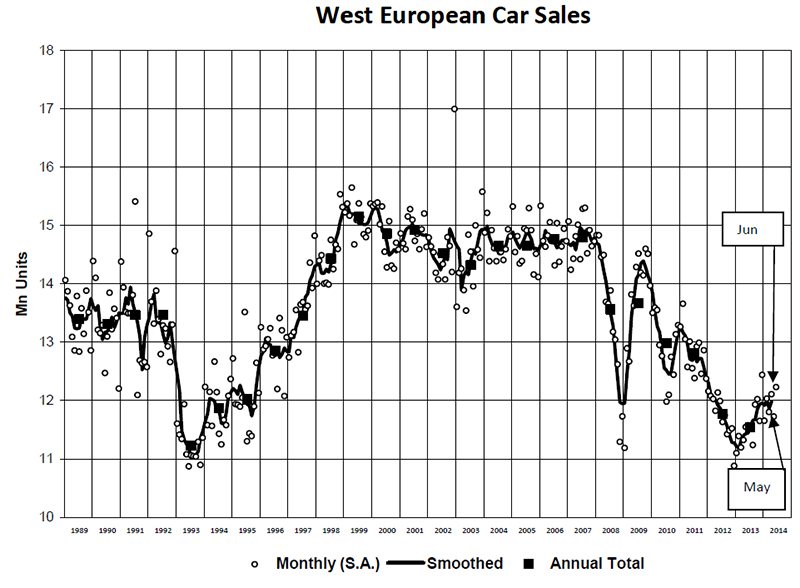
Car sales in Western Europe grew by 3.9% in June according to data released by LMC Automotive. In the first six months of 2014, the region’s sales were up 5% year-on-year, and the market remains on course for a solid full year expansion.
June’s result was the tenth consecutive month of expansion for the West European car market. The Seasonally Adjusted Annualised Rate (SAAR) of sales climbed to 12.2m units a year.

Discover B2B Marketing That Performs
Combine business intelligence and editorial excellence to reach engaged professionals across 36 leading media platforms.
Result for Germany: sales down by 1.9% – the year-to-date market was up by 2.4%. With one fewer selling day in Germany in June, the latest result is not as disappointing as the headline figure would first suggest – the selling rate climbed back above 3m units a year.
UK sales were up once again, with this market continuing to be a driving force for growth in the region this year. Car registrations in Spain grew by nearly a quarter last month, with the market benefiting from yet another iteration of the PIVE scrappage scheme.
The French car market improved well after a lacklustre May. Sales in Italy were also stronger, with the selling rate picking up to 1.4 mn units/year, the first time since May 2013.
|
Sales (units) |
||||||
|---|---|---|---|---|---|---|
|
June 2014 |
June 2013 |
% change |
YTD 2014 |
YTD 2013 |
% change |
|
|
WESTERN EUROPE |
1149668 |
1106636 |
3.9% |
6384560 |
6055943 |
5.4% |
|
AUSTRIA |
29564 |
31279 |
-5.5% |
167071 |
171204 |
-2.4% |
|
BELGIUM |
42397 |
43158 |
-1.8% |
287203 |
289873 |
-0.9% |
|
DENMARK |
17631 |
17551 |
0.5% |
98855 |
91965 |
7.5% |
|
FINLAND |
9202 |
8810 |
4.4% |
59129 |
56554 |
4.6% |
|
FRANCE |
196257 |
190172 |
3.2% |
958446 |
929626 |
3.1% |
|
GERMANY |
277614 |
282913 |
-1.9% |
1538268 |
1502630 |
2.4% |
|
GREECE |
7964 |
5648 |
41% |
37474 |
30364 |
23.4% |
|
IRELAND |
1689 |
1668 |
1.3% |
65881 |
53252 |
23.7% |
|
ITALY |
127489 |
122865 |
3.8% |
753657 |
732371 |
2.9% |
|
LUXEMBOURG |
4143 |
4320 |
-4.1% |
26872 |
26409 |
1.8% |
|
NETHERLANDS |
32950 |
35067 |
-6.0% |
199220 |
210799 |
-5.5% |
|
NORWAY |
11441 |
10948 |
4.5% |
72385 |
70644 |
2.5% |
|
PORTUGAL |
15740 |
12735 |
23.6% |
75772 |
55034 |
37.7% |
|
SPAIN |
90158 |
72769 |
23.9% |
454940 |
386345 |
17.8% |
|
SWEDEN |
28749 |
22871 |
25.7% |
151747 |
128945 |
17.7% |
|
SWITZERLAND |
28390 |
28905 |
-1.8% |
150376 |
156305 |
-3.8% |
|
UK |
228291 |
214957 |
6.2% |
1287265 |
1163623 |
10.6% |
|
Selling rate (units/year) |
||||
|---|---|---|---|---|
|
June 2014 |
YTD 2014 |
Year 2013 |
% change |
|
|
WESTERN EUROPE |
12229756 |
11925005 |
11543740 |
3.3% |
|
AUSTRIA |
308738 |
314505 |
319035 |
-1.4% |
|
BELGIUM |
472917 |
484788 |
486065 |
-0.3% |
|
DENMARK |
183267 |
195838 |
182198 |
7.5% |
|
FINLAND |
103509 |
101983 |
103451 |
-1.4% |
|
FRANCE |
1938644 |
1803095 |
1788698 |
0.8% |
|
GERMANY |
3035944 |
3031604 |
2952431 |
2.7% |
|
GREECE |
80875 |
67324 |
58696 |
14.7% |
|
IRELAND |
79431 |
89317 |
74309 |
20.2% |
|
ITALY |
1415960 |
1352523 |
1302480 |
3.8% |
|
LUXEMBOURG |
50879 |
46289 |
46624 |
-0.7% |
|
NETHERLANDS |
309017 |
342223 |
417156 |
-18.0% |
|
NORWAY |
145961 |
146391 |
142151 |
3% |
|
PORTUGAL |
145565 |
141659 |
105934 |
33.7% |
|
SPAIN |
894020 |
828741 |
722693 |
14.7% |
|
SWEDEN |
314211 |
303324 |
269197 |
12.7% |
|
SWITZERLAND |
281036 |
287913 |
307885 |
-6.5% |
|
UK |
2469783 |
2387489 |
2264737 |
5.4% |
Notes: Austria, Denmark, Luxembourg and Switzerland: estimates for latest month. The % change in the final column compares the average selling rate in the year-to-date with the last full year.


